





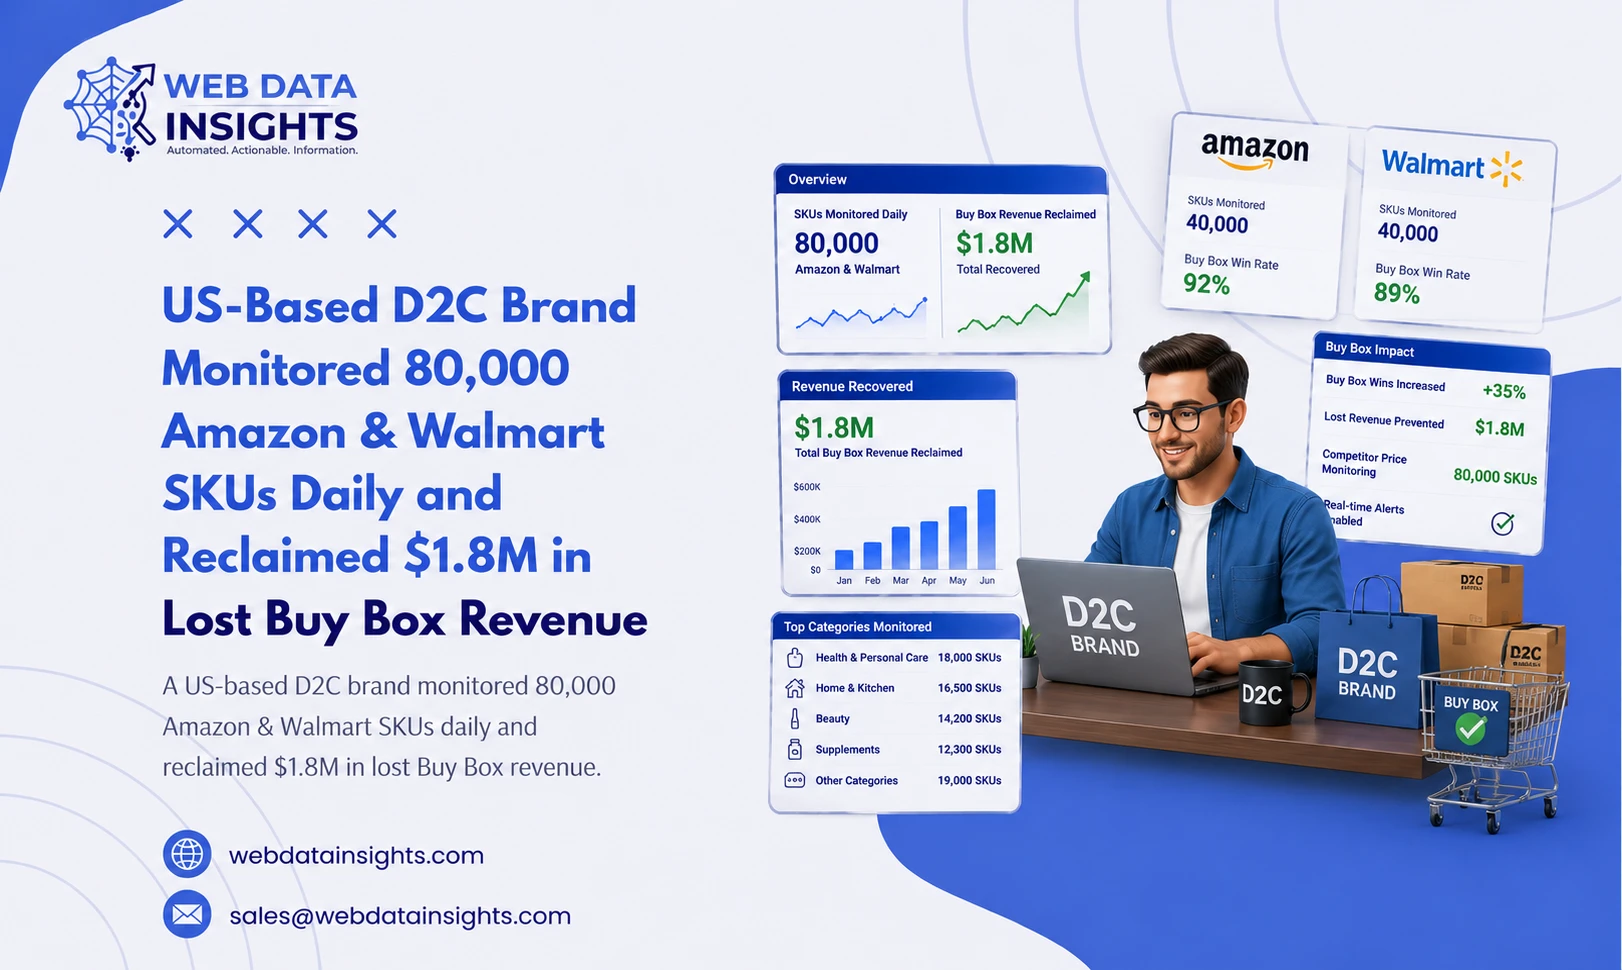
A US-based D2C brand monitored 80,000 SKUs across Amazon and Walmart every day and recovered $1.8 million in revenue that was quietly leaking through lost Buy Box ownership. Here’s how a structured monitoring system found the leaks — and closed them.
Executive Summary
A US-based D2C brand selling across Amazon and Walmart was losing revenue without a clear reason — sales dipped on specific SKUs even when demand and pricing looked normal. The root cause was Buy Box loss, invisible without daily, SKU-level visibility.
WebDataInsights implemented an amazon buy box monitoring in US system paired with walmart product data scraping in US, giving the brand daily visibility into 80,000 SKUs. Within one quarter, the brand recovered $1.8M in revenue that had been lost to competitors winning the Buy Box.
Client Background
The client is a US-based direct-to-consumer (D2C) brand (name withheld under NDA) selling a broad catalog of consumer products through both its own storefronts and third-party marketplaces, including Amazon and Walmart Marketplace.
With 80,000+ active SKUs listed across both platforms, the brand’s internal team lacked a reliable way to track Buy Box ownership, pricing shifts, and competitor activity at scale. Their existing process relied on spot-checks and manual reviews, which could not keep pace with marketplace volatility.
Business Challenge
Losing Revenue Without a Clear View of Buy Box Ownership
Buy Box ownership directly drives conversion on Amazon and Walmart — when a brand loses it, sales on that SKU can drop sharply within hours, even if the product page still ranks well. The client’s specific challenges included:
- No systematic amazon and walmart sku tracking US process across 80,000 listings.
- Buy Box losses going unnoticed for days, with no alerting in place.
- Limited us amazon walmart marketplace data analytics to correlate pricing changes with Buy Box outcomes.
- No consistent USA Walmart buy box tracking, since Walmart’s Buy Box logic differs from Amazon’s and required separate handling.
- Difficulty distinguishing MAP violations, reseller undercutting, and legitimate competitor pricing from marketplace noise.
Solution Strategy
Daily Amazon Marketplace Pricing Intelligence Across Both Platforms
WebDataInsights designed a monitoring framework built around daily, SKU-level data collection rather than periodic audits. The approach combined structured Amazon Product Dataset feeds with a parallel Walmart Product Dataset pipeline, so both marketplaces were tracked on a single, comparable framework.
- Continuous amazon and Walmart Seller data Scrape to capture seller counts, offer changes, and price movement per SKU.
- Amazon marketplace pricing intelligence to flag when competitor pricing triggered Buy Box loss.
- Daily ecommerce brands buy box data scrape reporting, so the client’s team saw Buy Box status changes the same day they occurred.
- Alerting thresholds tuned to the client’s margin requirements, avoiding noisy, low-value notifications.
Implementation Process
From SKU Mapping to Daily Buy Box Alerts
Step 1 — SKU & Catalog Mapping. Consolidated the client’s 80,000 SKUs across Amazon and Walmart into a unified tracking structure.
Step 2 — Daily Data Collection. Deployed automated collection for price, seller count, and Buy Box status on every SKU, every day, across both marketplaces.
Step 3 — Buy Box Loss Detection. Built logic to identify the exact SKUs and time windows where Buy Box ownership shifted away from the client.
Step 4 — Root Cause Analysis. Cross-referenced pricing intelligence data to determine whether losses were driven by competitor pricing, MAP violations, or inventory issues.
Step 5 — Action & Recovery. Client’s pricing and merchandising teams used daily reports to adjust pricing and enforce MAP policy on flagged sellers.
Step 6 — Ongoing Monitoring. Transitioned the client onto a continuous Amazon And Walmart Pricing Intelligence program to sustain gains long-term.
Results & Outcomes
| Metric | Result |
|---|---|
| SKUs monitored daily | 80,000+ across Amazon & Walmart |
| Lost Buy Box revenue recovered | $1.8M |
| Time to detect Buy Box loss | Same-day, down from multi-day delays |
| Reporting frequency | Daily, per-SKU |
| MAP violations identified | Flagged and actioned across both marketplaces |
The recovered revenue came primarily from SKUs where Buy Box ownership had quietly shifted to third-party sellers weeks earlier, unnoticed under the client’s previous manual review process.
Key Learnings
- Buy Box loss is often invisible without daily, SKU-level tracking — periodic manual checks miss most revenue leaks.
- Amazon and Walmart require separate tracking logic, since Buy Box rules differ meaningfully between the two marketplaces.
- Pairing pricing intelligence with Buy Box monitoring makes root-cause analysis faster and more actionable.
- Continuous monitoring, not one-time audits, is required to sustain Buy Box recovery over time.
Industry Relevance
Buy Box monitoring and marketplace pricing intelligence are relevant to any brand selling meaningful volume through Amazon or Walmart, especially in categories where competition for the Buy Box is intense.
Health & Personal Care
High reseller activity makes MAP enforcement and Buy Box tracking critical for margin protection.
Consumer Electronics
Fast price changes and multiple sellers per listing make daily monitoring essential.
Home & Kitchen
High SKU counts require automated tracking rather than manual review.
Grocery & CPG
Thin margins mean even small Buy Box losses have outsized revenue impact.
Apparel & Footwear
Frequent price and inventory changes demand continuous marketplace visibility.
Sporting Goods & Outdoor
Seasonal demand spikes make timely Buy Box recovery especially valuable.
Frequently Asked Questions
What is Amazon Buy Box monitoring?
Amazon Buy Box monitoring is the daily tracking of which seller holds the “Add to Cart” position on a product listing, allowing brands to detect and respond quickly when a competitor wins the Buy Box.
How does Walmart Buy Box tracking differ from Amazon?
USA Walmart buy box tracking follows different eligibility and pricing logic than Amazon, so brands need separate monitoring rules for each marketplace rather than a single shared model.
Why do brands lose the Buy Box even with competitive pricing?
Buy Box loss can result from seller performance metrics, shipping speed, inventory availability, or third-party sellers undercutting price — not pricing alone. Ongoing amazon marketplace pricing intelligence helps identify the exact cause.
How many SKUs can be monitored daily across Amazon and Walmart?
With an automated data pipeline, tens of thousands of SKUs — as demonstrated with 80,000 SKUs in this case study — can be monitored daily across both Amazon and Walmart without manual review.
What is the ROI of Buy Box monitoring for D2C brands?
ROI is measured in recovered revenue from reclaimed Buy Box ownership; in this case, daily ecommerce brands buy box data scrape and monitoring recovered $1.8M in previously lost revenue over one quarter.
Reliable Web Data Solutions
WebDataInsights provides clean, structured, and real-time web scraping solutions tailored to your business goals, helping automate data collection for eCommerce, market research, lead generation, and more.
Get in TouchReady to Turn Your Data into Revenue Growth?
Partner with WebDataInsights for enterprise-grade B2B data scraping, real-time price monitoring, supplier benchmarking intelligence, and seamless API data delivery.
Solve My Problem