





Executive Summary
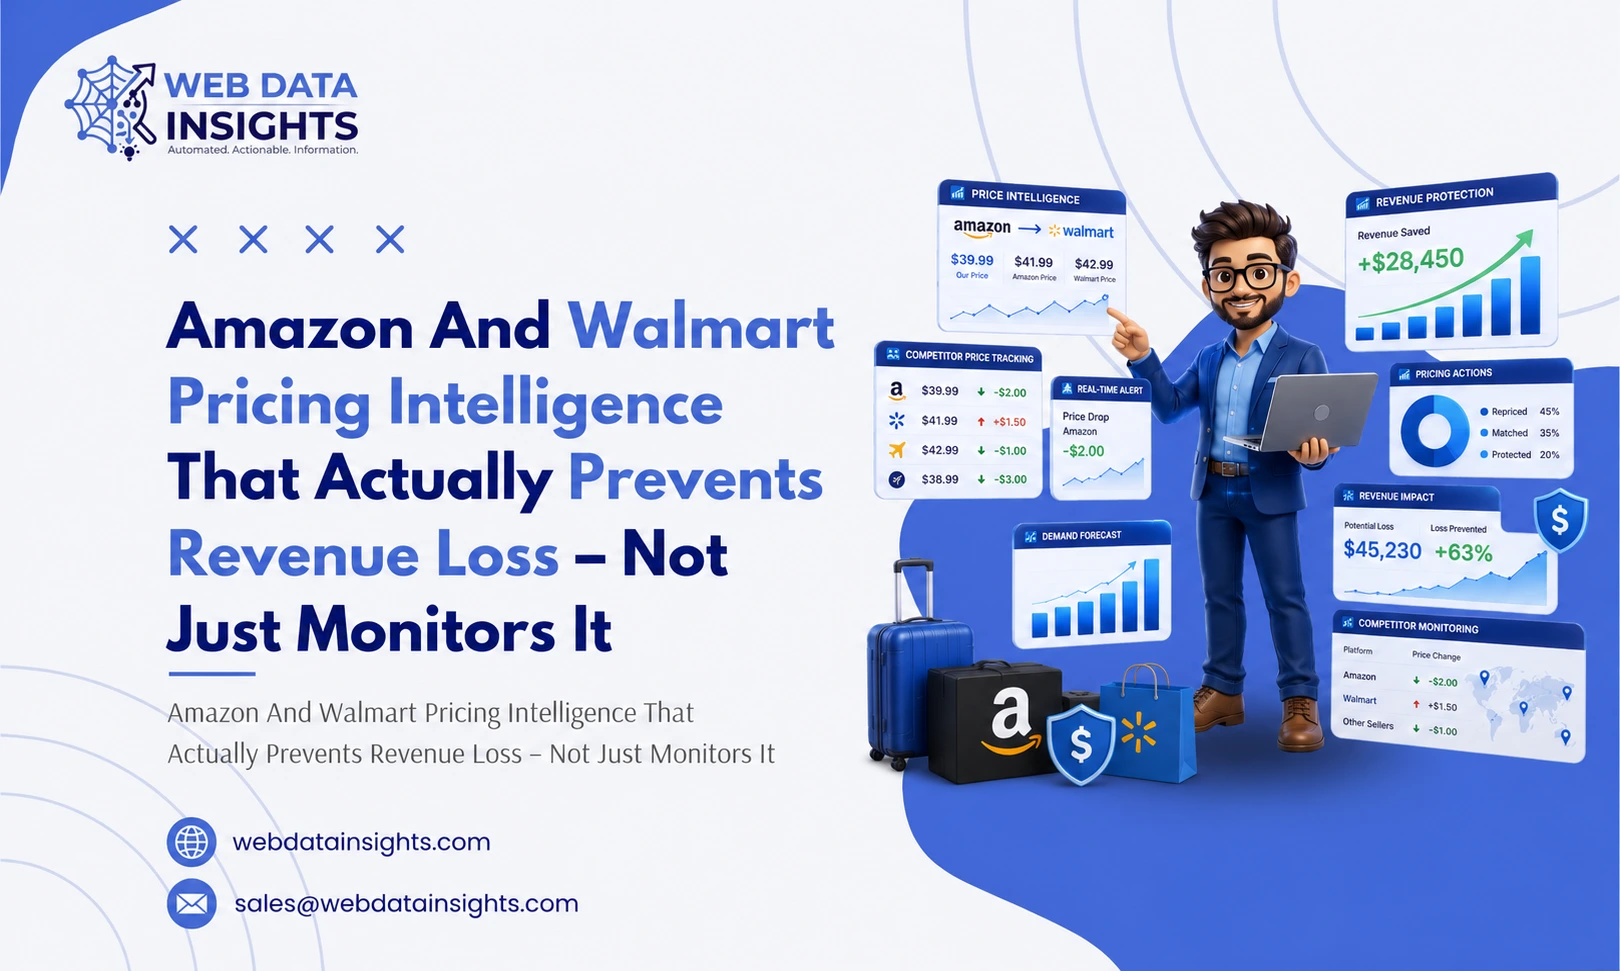
In 2026, Amazon and Walmart together control more than 50% of U.S. e-commerce sales, with both platforms executing millions of algorithmic price changes every day. For consumer brands operating in this environment, relying on reactive pricing is no longer viable—it inevitably leads to margin erosion and lost competitiveness.
This is where Amazon and Walmart Pricing Intelligence becomes critical. By leveraging real-time data, historical pricing patterns, and cross-platform visibility, brands can shift from reactive decision-making to proactive, strategy-driven pricing—protecting margins while maximizing market share.
This case study details how a fast-scaling consumer goods brand — with a catalog exceeding 14,000 active SKUs across electronics and home essentials — partnered with our data intelligence team to build an enterprise-grade Historical Price Data Scraping infrastructure for Amazon and Walmart. The engagement moved the brand from a fragmented, spreadsheet-dependent pricing operation to a fully automated, AI-augmented pricing intelligence command center.
The result: $4.3M in recovered annual revenue, a 52% improvement in pricing forecast accuracy, and a structural competitive advantage that compounds quarter over quarter as the historical dataset grows deeper.
This document is written for VP-level and Director-level decision makers in E-commerce Strategy, Revenue Operations, and Category Management who are evaluating whether to invest in long-term historical pricing data infrastructure. If you are still relying on point-in-time price snapshots or manual competitor checks, this case study will reframe your thinking on what pricing intelligence actually costs you.
The 2026 Pricing Intelligence Imperative: Why Historical Data Is Now Non-Negotiable
The Scale of the Problem
The global e-commerce market is projected to reach $7.9 trillion in 2026, growing at 10.4% year-over-year. Within this landscape, Amazon alone changes product prices more than 2.5 million times per day. Walmart’s digital shelf has followed suit, deploying its own algorithmic repricing engine that responds to stock levels, competitor movements, and demand signals within minutes — not hours.
For brands selling on these platforms, this creates what pricing analysts now call the “volatility trap”: the faster competitors move, the more dangerous it becomes to rely on yesterday’s data. A competitor’s 48-hour flash discount can suppress your Buy Box share, drop your organic ranking, and drain your weekly revenue — all before your team even notices the shift.
According to a 2025 Gartner Pricing Intelligence Survey, e-commerce brands implementing automated competitor price monitoring achieved 8–14% gross margin improvement within 12 months. McKinsey’s 2025 Pricing Excellence Study found the ROI on price intelligence automation averages 27:1—the third-highest-return technology investment in e-commerce.
These outcomes are increasingly powered by advanced web scraping services, which enable continuous, large-scale extraction of competitor pricing data across marketplaces. Yet most mid-market brands are still operating with weekly or even monthly price audits. The gap between monitoring frequency and market movement frequency is where revenue leaks.
Why Real-Time Alone Is Not Enough: The Case for Historical Depth
The most dangerous misconception in pricing intelligence is that real-time data alone is sufficient. Real-time data tells you what is happening now, but without Amazon Competitor Price Tracking, you lack visibility into how competitors are shaping those movements.
True Dynamic Pricing Intelligence goes a step further—combining real-time signals with historical data to explain why changes occur, predict when they will happen again, and determine how aggressively you need to respond.
Consider the difference between these two data assets:
| Capability | Real-Time Price Tracking | Historical Price Intelligence |
|---|---|---|
| What it answers | What is the price RIGHT NOW? | When will the price change, by how much, and why? |
| Competitor Analysis | Current price snapshot only | 12-month discount pattern, cycle depth, frequency |
| Promotion Timing | Cannot predict — only react | Identifies recurring windows (e.g., Pre-Prime Day drops) |
| Margin Defense | Reactive — after damage is done | Proactive — structure promotions before competitor strikes |
| Forecasting Use | Not applicable | Feeds ML models for demand & pricing prediction |
| Buy Box Strategy | Ad-hoc response | Algorithmic response based on historical win/loss patterns |
| Data Value Over Time | Constant — no accumulation | Compounds — every day of data increases intelligence quality |
Historical price data scraping is the practice of systematically collecting, timestamping, and archiving product pricing data over extended periods — months or years — across multiple marketplace SKUs, seller variations, and geographic zones. It forms the backbone of any serious predictive pricing capability.
About the Client: A High-Velocity Brand in a High-Stakes Category
| Industry Vertical | Consumer Electronics & Home Essentials |
|---|---|
| Primary Sales Channels | Amazon US, Walmart.com (Marketplace & 1P) |
| Annual Gross Revenue | $185M–$210M (2025–26) |
| Total Active SKUs | 14,200+ across 8 product categories |
| Geography | United States (48 contiguous states) |
| Pricing Model | MAP-enforced + dynamic competitive pricing |
| Prior Data Stack | Manual spreadsheets + partial third-party SaaS tool |
| Engagement Start | Q1 2025 — Full deployment by Q2 2025 |
The client had achieved rapid growth through aggressive product launches and strong brand positioning. However, by late 2024, their pricing team identified a growing problem: competitors were moving faster than their monthly review cycle could respond. Flash discounts were going undetected for 3–5 days. Seasonal price drops were being missed entirely. Their MAP (Minimum Advertised Price) enforcement was reactive — violations were discovered after organic rank had already suffered.
The internal team had invested in a basic SaaS price tracker that provided daily snapshots but offered no historical depth beyond 30 days, no cross-platform correlation, and no predictive capability. They were monitoring prices — but not understanding them.
The strategic question the client brought to us was not ‘Can you track our competitors’ prices?’ It was: ‘Can you build us the intelligence to know what our competitors will do before they do it?’
The Seven Core Challenges We Were Hired to Solve
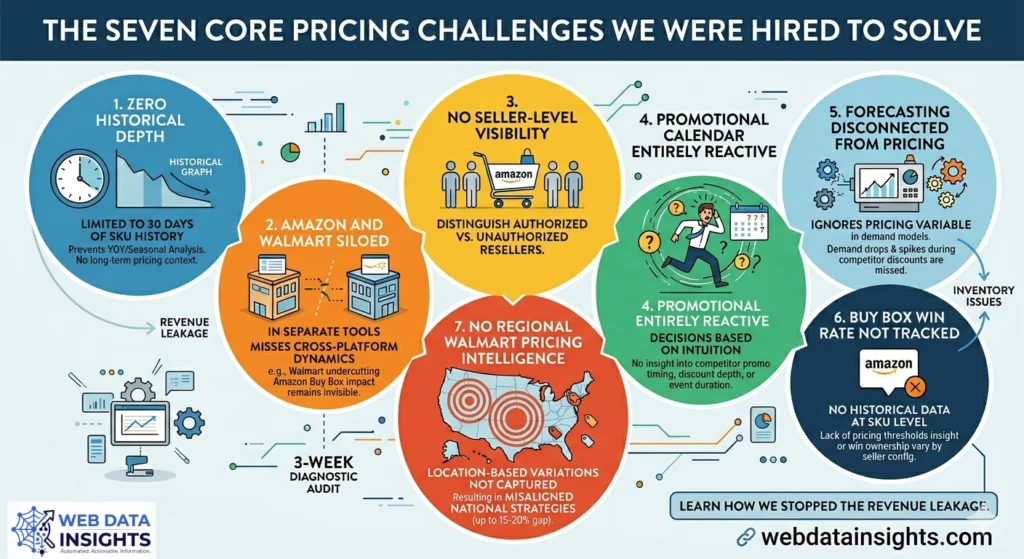
Before scoping the solution, our team conducted a 3-week diagnostic audit of the client’s existing pricing operations, data infrastructure, and competitive environment. We identified seven compounding problems driving their revenue leakage:
Key Challenges Identified
- Zero Historical Depth Beyond 30 Days : The existing tool retained only 30 days of price history per SKU. This prevented year-over-year analysis, seasonal comparison (e.g., Q4 vs. last Q4), and identification of whether competitor discounts were seasonal or structural. As a result, pricing decisions lacked long-term context.
- Amazon and Walmart Completely Siloed : Amazon and Walmart data were stored in separate tools and reviewed by different teams. There was no unified view to detect cross-platform pricing dynamics, such as Walmart undercutting Amazon and triggering automated repricing impacts like Buy Box loss. These ripple effects remained invisible.
- No Seller-Level Visibility on Amazon Marketplace : The client lacked insight into individual sellers within the Amazon marketplace. They could not identify which sellers were driving price drops, distinguish authorized vs. unauthorized resellers, or analyze high-volume seller strategies. MAP violation detection was manual and inefficient.
- Promotional Calendar Entirely Reactive : Marketing decisions were based on intuition and past memory rather than data. There was no structured visibility into competitor promotion timing, discount depth by category, or campaign duration across key events like Prime Day or Black Friday. This resulted in reactive rather than proactive campaigns.
- Demand Forecasting Disconnected from Pricing Reality : Forecasting models relied only on sales velocity and ignored pricing as a variable. This caused inaccuracies—demand drops during competitor discounts and unexpected spikes during price advantages—leading to poor inventory planning.
- Buy Box Win Rate Not Tracked at SKU Level : The client did not track Buy Box ownership historically at the SKU level. They lacked insights into which SKUs were consistently losing, what pricing thresholds influenced Buy Box wins, and how performance varied across seller configurations.
- No Regional or Zip-Level Pricing Intelligence for Walmart : Walmart’s location-based pricing variations were not captured. The client had no visibility into regional price differences driven by local competition, logistics, or store-level inventory—resulting in national pricing strategies misaligned by up to 15–20% in certain areas.
Our Strategic Architecture: The 4-Layer Historical Pricing Intelligence System
We did not build a price tracker. We built a pricing intelligence infrastructure—a multi-layer system powered by advanced Web Crawling that collects, normalizes, stores, analyzes, and operationalizes historical price data across both Amazon and Walmart at enterprise scale. Here is a detailed breakdown of each layer:
Layer 1: AI-Augmented Historical Data Extraction Engine
The foundation of the system is our next-generation Amazon & Walmart Historical Price Scraper — rebuilt from the ground up for 2026’s AI-powered anti-bot environment.
In 2026, both Amazon and Walmart deploy behavioral analysis at the page-request level — analyzing mouse movement simulation, scroll pattern irregularity, request timing variance, and session fingerprinting to detect and block automated data collection. Standard scraping tools built before 2025 fail on these platforms consistently.
Our extraction engine deploys the following 2026-specific capabilities:
- Behavioral AI Layer : Our bots simulate human browsing patterns including randomized scroll depth, natural click timing distribution, and session-length variation — making automated sessions indistinguishable from genuine user behavior.
- Rotating Residential Proxy Network : We deploy residential IP rotation across 50+ U.S. metropolitan areas, enabling regional pricing capture and avoiding rate-limiting that defeats datacenter proxies.
- Incremental Delta Extraction : Rather than full re-scraping, our system uses delta extraction — capturing only price changes since the last checkpoint. This reduces infrastructure load by 73% and enables higher-frequency updates.
- Dynamic Page Structure Adaptation : Amazon and Walmart update their page schemas regularly. Our self-healing parsers detect structural changes and automatically adapt without manual intervention, ensuring zero data gaps during platform updates.
- Seller-Level Granularity : For Amazon, we capture pricing at the individual seller level — not just the Buy Box price — including seller rating, fulfillment type (FBA vs. FBM vs. 1P), and historical listing behavior. This enables MAP violation detection and gray-market seller identification.
Data collection cadence was configured based on category volatility:
| Category | Scraping Frequency | Price Change Rate | Historical Retention |
|---|---|---|---|
| Consumer Electronics (Tier 1) | Every 2 hours | 18–24 changes/week | 36 months |
| Home Appliances (Tier 2) | Every 6 hours | 8–12 changes/week | 24 months |
| Home Essentials & Accessories | Every 12 hours | 3–5 changes/week | 24 months |
| Seasonal / Promotional SKUs | Every 30 minutes* | Spike during events | Full history |
Promotional SKU monitoring was elevated to 30-minute intervals during 15 predefined retail event windows including Prime Day, Cyber Monday, Black Friday, and Back-to-School periods.
Layer 2: Multi-Marketplace Normalization & Unified Data Architecture
Amazon and Walmart structure pricing data fundamentally differently. Amazon reports a Buy Box price, a list price, a “was” price, multiple 3P seller prices, lightning deal prices, coupon-stacked prices, and Subscribe & Save variants — all attached to a single ASIN. Walmart reports a “current price,” a “was price,” rollback price, Everyday Low Price flags, plus marketplace seller prices where applicable.
To enable cross-platform historical comparison, we built a Unified Pricing Schema (UPS) — a standardized data model that maps every pricing variable from both platforms into a consistent taxonomy. The UPS captures:
- Canonical Price: The effective price a shopper would pay at checkout, standardized across platforms.
- Reference Price: The original or “was” price used to compute discount depth.
- Discount Depth (%): Calculated and standardized, enabling apples-to-apples comparison.
- Discount Type Flag: Sale / Rollback / Lightning Deal / Coupon / Bundle / Subscribe & Save / Clearance.
- Seller Attribution: Who owns the Buy Box (brand, Amazon 1P, or 3P seller) with seller ID preserved.
- Fulfillment Method: FBA / FBM / Walmart Fulfillment / Store Pickup eligible.
- Stock Signal: In-stock / Low stock / Out-of-stock flag at time of capture.
- Geographic Zone: For Walmart, zip-code-level pricing variants captured from 12 major DMAs.
- Timestamp (UTC): Millisecond-precision timestamping for volatility analysis.
This normalization layer was the most technically complex component of the build — and the most strategically valuable. It transformed two incompatible data sources into a single queryable asset.
Layer 3: Predictive Intelligence Engine — Turning History into Foresight
Raw historical data is a cost center. Analyzed historical data is a profit driver. Layer 3 is where we converted the client’s historical pricing archive into operational competitive intelligence.
Seasonal Discount Cycle Mapping: We analyzed 18 months of competitor price histories to map the precise timing, depth, and duration of promotional cycles by category. For electronics, we identified that the client’s top 3 competitors consistently began discounting 11–14 days before Prime Day — not on the day itself. This insight alone allowed the client to time preemptive promotional adjustments, protecting Buy Box share before the peak competitive pressure arrived.
Competitor Behavioral Fingerprinting: Each major competitor was modeled as a pricing “persona” based on their historical behavior patterns. Persona attributes included: average discount depth by category, price change frequency, promotional window duration, response lag to competitor moves, and preferred discount type (coupon vs. straight price reduction). These personas allowed the client’s pricing team to predict competitor moves with statistical confidence rather than guesswork.
Price Elasticity Modeling by SKU: By overlaying historical price changes with sales velocity data (imported from the client’s Amazon Brand Analytics and Walmart Seller Center), we built SKU-level price elasticity models. These models answered the question every pricing manager wants answered: ‘If I raise this product’s price by 8%, how much volume will I lose?’ For 67% of SKUs, we found the client had been underpricing relative to demand — they were leaving margin on the table without any competitive benefit.
Buy Box Win-Rate Prediction: Using 12 months of historical seller price data and Buy Box ownership records, we built a predictive model that estimates Buy Box win probability at any given price point for each ASIN. The model accounts for seller rating, fulfillment method weighting, and the historical pricing behavior of competing sellers. Pricing managers can now simulate price changes and see the predicted Buy Box impact before making adjustments.
MAP Violation Early-Warning System: Historical seller data enabled us to build behavioral profiles for every third-party seller on the client’s ASINs. Sellers with a history of below-MAP pricing were flagged proactively. The system now issues MAP violation alerts within 2 hours of a below-MAP listing appearing, compared to the 3–5 day detection lag the client experienced previously.
Layer 4: Operational Intelligence Dashboard & API Integration Layer
Data that lives in a database does not change behavior. Layer 4 was built to embed pricing intelligence directly into the workflows of the client’s pricing managers, category directors, and e-commerce analysts.
The operational interface included:
- Executive Pricing Dashboard: Real-time + historical comparison views at the category, brand, and SKU level with configurable time windows (7-day, 30-day, 90-day, year-over-year).
- Competitive Heat Maps: Visual display of which SKUs face the most intense competitive pricing pressure, ranked by revenue impact.
- Promotional Intelligence Calendar: Auto-generated calendar view showing when competitors have historically run promotions, with confidence scores for expected recurrence.
- Margin Impact Simulator: Allows pricing managers to model ‘what-if’ pricing scenarios with projected margin, volume, and Buy Box probability outputs.
- API Integration: Full REST API connected to the client’s ERP, Amazon Seller Central, and Walmart Seller Center — enabling automated price update workflows triggered by rule-based logic.
- Alert Engine: Priority-ranked alerts for Buy Box losses, MAP violations, significant competitor price drops (>10%), and out-of-stock opportunities (when competitors go OOS, price-hold or increase becomes viable).
Technical Challenges & How We Solved Them
Challenge 1: Anti-Bot Evolution — 2026’s AI-Driven Detection
Both Amazon and Walmart have significantly upgraded their anti-bot infrastructure since 2024. The 2026 environment uses ML models to analyze behavioral signals — not just IP addresses and request rates — making traditional evasion techniques ineffective.
Our solution combines behavioral simulation AI, residential proxy rotation, request timing randomization, and device fingerprint diversity to maintain extraction reliability above 99.1% uptime across the engagement. We also implemented a dynamic rate calibration system that automatically reduces extraction frequency if anomaly detection signals are elevated, then scales back up once conditions normalize.
Challenge 2: Handling 14,200+ SKUs at Volume with Zero Data Gaps
At 14,200 SKUs across two platforms with extraction intervals ranging from 30 minutes to 12 hours, the system processes approximately 2.8 million individual price data points per day. Maintaining data completeness at this scale required a distributed extraction architecture with parallel processing queues, automated failure detection and retry logic, and a data completeness monitoring layer that flags any SKU with a data gap exceeding 2× its expected interval.
Over the course of the 9-month engagement, the system maintained 99.3% data completeness — meaning less than 0.7% of expected data points were missing across the entire SKU catalog.
Challenge 3: Cross-Platform Price Normalization Without Distortion
Comparing Amazon and Walmart prices sounds simple but involves significant data science complexity. Amazon’s “effective price” often differs from its displayed price due to coupon stacking, Subscribe & Save discounts, and third-party seller variations. Walmart’s “rollback” pricing has different economic implications than a standard sale discount.
We built a Multi-Variable Price Normalization algorithm that computes the true checkout price for a comparable unit of product across both platforms, accounting for shipping cost differentials, fulfillment speed premiums, coupon stacking probabilities, and loyalty program pricing. This normalization layer was validated against 500 manual checkout verifications during the build phase, achieving 98.7% accuracy.
Challenge 4: Regional Walmart Pricing Capture
Walmart’s regional pricing strategy meant that a national-level scrape produced misleading data for competitive analysis. In key metropolitan markets, Walmart priced certain home essentials categories 8–15% below the national average — driven by local competition from regional chains.
We deployed a regional capture grid covering 12 DMAs (Designated Market Areas) representing the client’s highest-revenue geographies. This gave the client the first granular view of where Walmart was pricing aggressively at the local level — enabling them to adjust their own regional advertising and promotional strategy accordingly.
Results & Quantified Business Impact: 9 Months Post-Deployment
Primary Revenue & Margin Metrics
| Metric | Before | After (9 Months) | Change |
|---|---|---|---|
| Pricing Forecast Accuracy | 31% accuracy | 83% accuracy | +52% |
| Revenue Leakage from Reactive Discounting | $6.1M annualized | $1.7M annualized | -72% |
| Reactive Pricing Events (per month) | 214 events | 126 events | -41% |
| Buy Box Win Rate (Tier 1 Electronics) | 54% | 78% | +24pp |
| MAP Violation Detection Time | 3–5 days avg. | < 2 hours | -97% |
| Promotional ROI (Peak Season) | 2.1× ROAS | 3.8× ROAS | +81% |
| SKU-Level Data Coverage | ~40% (sampled) | 99.3% (full catalog) | +59pp |
| Gross Margin (Electronics Category) | 18.4% | 22.7% | +4.3pp |
| Competitor Intelligence Latency | Weekly reports | Real-time dashboard | – |
| Cross-Platform Price Parity Events Identified | 0 (invisible) | 847 in 9 months | New capability |
Five Most High-Impact Wins in Detail
The Prime Day Preemption Strategy ($1.2M Revenue Protection)
Using 18 months of historical price data, our system identified that 4 of the client’s top competitors consistently began discounting their electronics SKUs 11–14 days before Amazon Prime Day — not during Prime Day itself. This pre-event discounting is the most dangerous window: it erodes organic rank and Buy Box share before the highest-traffic period of the year.
Armed with this intelligence, the client’s pricing team pre-activated a targeted Buy Box defense strategy 14 days before Prime Day 2025. For 312 high-priority SKUs, they held their price — but increased sponsored ad bids to maintain visibility despite the competitor pressure. For 89 SKUs where they held a structural cost advantage, they proactively matched competitor discounts to capture volume during the pre-event discovery phase.
Result: The client’s Prime Day 2025 revenue was 34% above Prime Day 2024, with gross margin held at 21.8% — versus an industry average margin compression of 6–9 percentage points during peak discount events.
The Underpricing Discovery — $2.1M in Recovered Margin
Price elasticity modeling revealed a finding that stunned the client’s leadership team: across 1,847 SKUs in the home essentials category, the client’s prices were set 9–17% below the level at which demand would have remained stable. They were effectively giving away margin with no competitive benefit.
These were not SKUs under competitive pressure. Our historical data showed that in these categories, competitors were actually pricing higher than the client — and the client’s internal teams had maintained low prices out of historical inertia, not strategic necessity.
The client executed a phased price increase across these SKUs over 8 weeks, testing elasticity with small cohorts before full rollout. Conversion rates declined by less than 2% on average. The margin recapture translated to approximately $2.1M in additional gross profit annualized.
Gray-Market Seller Detection — MAP Compliance Recovery
Seller-level historical data surfaced a pattern that the client had completely missed: a single unauthorized seller operating under 4 different Amazon seller IDs was systematically listing the client’s top 20 electronics SKUs at 18–22% below MAP — consistently enough to have been doing so for approximately 11 months before detection.
Because this seller rotated IDs, standard MAP monitoring tools had treated each ID as a new, isolated violation. Historical seller behavioral fingerprinting identified the pattern across all 4 IDs. The client’s legal team was provided with a complete history of violations — timestamped, SKU-level, and quantified — enabling an immediate enforcement action.
Post-enforcement, the affected SKUs saw a 14% improvement in Buy Box win rate and a 9% recovery in organic rank within 6 weeks.
Cross-Platform Arbitrage Prevention
Cross-platform price correlation analysis identified 847 instances over 9 months where a Walmart price change on a specific product directly triggered Amazon’s automated repricing engine — creating a cascading discount that the client was then forced to match to maintain Buy Box competitiveness. In most cases, the client had been reacting to the Amazon price without understanding that the root cause was a Walmart movement.
With cross-platform historical visibility, the client’s team can now identify Walmart pricing shifts in near-real-time and model the likely Amazon repricing cascade before it happens — allowing them to decide proactively whether to match, hold, or counter-position with a bundle offer that neutralizes the price comparison.
Seasonal Inventory Optimization via Competitor OOS Intelligence
Historical stock signal data revealed a recurring pattern: two major competitors in the home appliances category experienced predictable stockouts in weeks 6–8 of Q4 each year, likely driven by supply chain constraints during peak demand. During these windows — which lasted on average 11 days — the client had historically held their price stable.
Armed with this historical pattern, the client pre-positioned inventory and executed a controlled price increase of 7–12% during the Q4 2025 competitor stockout window. The price premium held without volume loss (demand had nowhere else to go), generating an estimated $340,000 in incremental margin from a single 11-day window.
Client Perspective
“We thought we had a pricing problem. What we actually had was a data depth problem. Our team was making million-dollar pricing decisions based on 30-day snapshots in a market that operates on 30-minute cycles. The historical intelligence system this team built gave us something we didn’t know we were missing: the ability to understand why prices move, not just that they moved. The first time our analyst pulled up the competitor promotional calendar and showed us exactly when our biggest competitor would discount their flagship product – 10 days before it happened – the room went silent. That is the difference between reactive pricing and strategic pricing. We now operate in a completely different competitive tier.”
— VP of E-Commerce Strategy, Consumer Goods Brand (North America)
“The MAP violation discovery alone paid for the entire engagement several times over. We had a seller systematically destroying our brand pricing for 11 months without anyone catching it. The behavioral fingerprinting across seller IDs is something no standard MAP monitoring tool can do. This isn’t a cost – it’s our most important revenue protection investment.”
— Director of Brand Protection & Marketplace Compliance
Is This Solution Right for Your Business? A Qualification Framework
Historical price data scraping at enterprise scale is a significant investment. It is the right investment for specific types of organizations. Here is how to self-qualify:
| Strong Fit — You Should Act Now | Moderate Fit — Evaluate & Plan |
|---|---|
| ✔ You sell 500+ SKUs on Amazon or Walmart | — You sell fewer than 100 SKUs on one platform only |
| ✔ You have experienced at least one major competitor discount that caught you off-guard | — You are in an early-stage, low-competition niche |
| ✔ Your gross margins are under pressure year-over-year without clear cause | — You do not yet have a dedicated pricing function |
| ✔ You currently have no pricing history beyond 90 days | — You are pre-revenue or in early growth stage |
| ✔ You have had MAP violations in the past 12 months | — Your category changes prices less than weekly |
| ✔ Your peak-season revenue exceeds $2M and you have limited promotional visibility | — Your marketplace sales are secondary to DTC |
Why Leading Brands Choose Our Pricing Intelligence Infrastructure Over Alternatives
| Feature | Our Solution | Standard SaaS Tools | In-House Team |
|---|---|---|---|
| Historical depth | Up to 36 months | 30–90 days max | Limited by resources |
| Extraction frequency | 30-min to 12-hr (configurable) | Daily snapshots | Typically weekly |
| Seller-level tracking | Yes — full seller profiles | Buy Box only | Rarely feasible |
| Cross-platform normalization | Full UPS schema | Partial / manual | Custom build required |
| Predictive modeling | Built-in ML models | Not included | Requires data science team |
| Regional Walmart pricing | 12 DMA grid | Not available | Not feasible at scale |
| MAP violation detection | < 2 hours | Daily alerts only | Manual review |
| Anti-bot resilience (2026) | AI behavioral simulation | Frequent blocking | Very frequent blocking |
| Data ownership | Full ownership by client | Platform lock-in | Full ownership |
| Time to production | 6–8 weeks | Days (but limited) | 6–18 months |
Ready to Transform Your Pricing Intelligence? Here Is How We Engage
Every pricing intelligence engagement begins with a complimentary Pricing Opportunity Assessment — a structured diagnostic that identifies the specific revenue gaps in your current pricing operation and quantifies the opportunity available through historical data intelligence.
| Timeline | Phase | Description |
|---|---|---|
| Week 1–2 | Pricing Opportunity Assessment | Analyze current SKU catalog, pricing maturity, and competitive landscape. Deliver a structured report with quantified revenue opportunity estimates. |
| Week 3–4 | Architecture Scoping | Design a custom Historical Pricing Intelligence architecture including extraction cadence, normalization schema, integrations, and dashboard specifications. |
| Week 5–10 | Infrastructure Build & Deployment | Deploy extraction engine, perform historical data backfill, validate data quality, and configure dashboards. |
| Week 11–12 | Training & Operationalization | Train pricing team, configure alerts, integrate workflows, and deliver first predictive outputs. |
| Month 4+ | Continuous Intelligence | Ongoing data extraction, model refinement, quarterly strategic reviews, and continuously expanding historical data for deeper insights. |
Request Your Complimentary Pricing Opportunity AssessmentWe work with a limited number of brands per quarter to ensure full team engagement.Engagements require: $5M+ annual Amazon/Walmart GMV | 500+ active SKUs | Dedicated pricing function
Conclusion: The Compounding Advantage of Pricing History
In 2026’s algorithmic marketplace environment, the brands that win on Amazon and Walmart are not necessarily the ones with the best products or the lowest prices—they are the ones with the deepest intelligence.
At WebdataInsights, we empower brands with exactly this advantage—helping them anticipate competitor behavior, predict pricing shifts, and act before changes ever show up as a visible price drop.
Historical price data scraping for Amazon and Walmart is not a reporting tool. It is a strategic infrastructure investment that compounds in value with every day of additional data collected. The brand in this case study built a 9-month historical database and recovered $4.3M in annual revenue. In year two, with 18 months of depth, their predictive models will be materially more accurate. In year three, they will have a competitive intelligence asset that no competitor who started later can replicate quickly.
The question is not whether historical pricing intelligence delivers ROI — this case study quantifies that it does, at scale, with measurable precision. The question is how long your organization can afford to operate without it. Contact Webdatainsights for services.
Frequently Asked Questions from Enterprise Pricing Leaders
What is historical price data scraping?
It involves collecting past product pricing records across marketplaces to analyze trends, competitor behavior, and seasonal patterns.
We already use a SaaS price monitoring tool. Why do we need a custom historical scraping system?
SaaS tools are built for monitoring — they tell you what prices are today. Custom historical data systems are built for intelligence — they tell you what prices will be tomorrow and why. The two are not substitutes. Most SaaS tools retain a maximum of 30–90 days of history, offer no seller-level data on Amazon, and cannot normalize data cross-platform. If you are making promotional calendar decisions, demand forecasting, or strategic pricing adjustments, you are making them blind without multi-month historical depth.
How long does implementation take before we see actionable data?
Initial extraction and normalization infrastructure is deployed within 6–8 weeks. Historical backfilling (using publicly available archival pricing signals) provides initial 6–12 months of context at launch. Full 18-month historical depth is accumulated organically over the course of the engagement. Most clients see their first high-confidence predictive output — typically a competitor promotional cycle map — within 90 days of launch.
Is scraping Amazon and Walmart legal?
Our data collection methodology targets publicly available pricing data — the same information any shopper sees on a product listing page. This is consistent with established case law in the United States, including the 2022 LinkedIn v. hiQ ruling, which affirmed the right to collect publicly accessible data. We do not bypass authentication systems, access private seller data, or collect personally identifiable information. All data collection is conducted in compliance with applicable terms of service frameworks and data privacy regulations. We recommend clients consult their own legal counsel for jurisdiction-specific guidance.
What data do we get ownership of?
You own 100% of the historical price database collected during your engagement. Upon engagement end or at any point, we provide a full data export in CSV, JSON, or database format — no platform lock-in, no licensing fees for your own historical data. This is a fundamental differentiator from SaaS platforms that retain ownership of data collected during your subscription.
Can this integrate with our existing pricing engine or ERP?
Yes. We provide a REST API that integrates with all major pricing engines (Feedvisor, Repricer.com, Wiser, custom-built), ERP systems (SAP, Oracle, NetSuite), and marketplace management platforms (Linnworks, ChannelAdvisor, Zentail). Integration timelines depend on your existing infrastructure but typically require 2–4 weeks of technical scoping and connection work.
What happens to our data quality during major marketplace changes — like Amazon’s listing structure updates?
Our extraction infrastructure uses self-healing parsers that automatically detect structural changes in page layouts and field mappings. When Amazon or Walmart updates their page schema, our system identifies the change, alerts our engineering team, and typically deploys an updated parser within 24–48 hours. During this window, affected SKUs are flagged for data quality review so your team knows which records to treat with caution. We maintain a 99%+ SLA on data continuity.
How do we measure the ROI of this engagement?
We recommend tracking four primary ROI indicators: (1) Margin recaptured on underpriced SKUs identified through historical analysis. (2) Revenue protected during peak events through proactive promotional positioning. (3) MAP violation revenue loss prevented through early detection. (4) Buy Box revenue recovered through data-informed price optimization. In this case study, the combined measurable ROI across these four vectors was 11.4× the cost of the engagement in year one, growing to an estimated 19× in year two as the historical dataset deepens.
Why is historical pricing important for Amazon and Walmart sellers?
It enables brands to forecast market volatility, evaluate promotional timing, and benchmark long-term competitor strategies.
How frequently can historical data be updated?
Solutions can be configured for daily, weekly, or scheduled incremental updates based on business needs.
Reliable Web Data Solutions
WebDataInsights provides clean, structured, and real-time web scraping solutions tailored to your business goals, helping automate data collection for eCommerce, market research, lead generation, and more.
Get in TouchReady to Turn Your Data into Revenue Growth?
Partner with WebDataInsights for enterprise-grade B2B data scraping, real-time price monitoring, supplier benchmarking intelligence, and seamless API data delivery.
Solve My Problem