





Research Summary
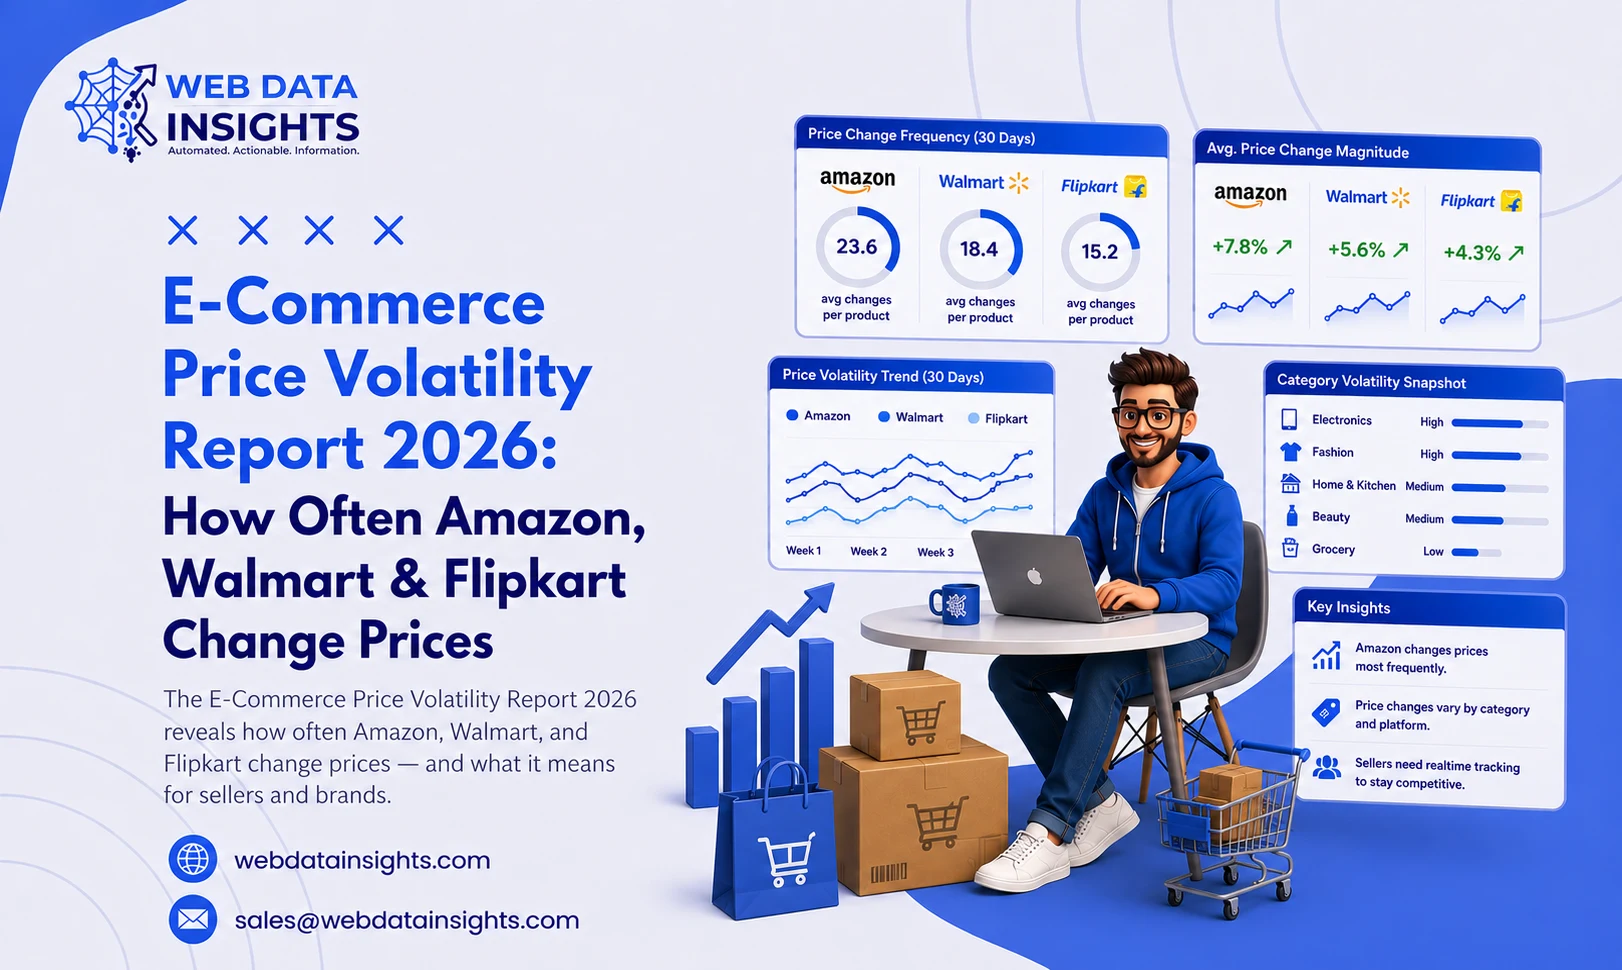
The E-Commerce Price Volatility Report 2026 examines how frequently and how significantly prices change on three of the world’s largest marketplaces — Amazon, Walmart, and Flipkart. This Amazon, Walmart & Flipkart Price Change Analysis 2026 is based on structured, repeated monitoring of listed prices across multiple product categories, tracked across daily and intra-day intervals.
Price volatility — how often and how much a listed price moves — directly affects seller margins, buy-box eligibility, and brand pricing consistency. This report quantifies that volatility and translates it into practical guidance for sellers and brand teams.
Key Terms at a Glance
- E-commerce price volatility analysis — the ongoing study of how often and how much marketplace prices change, used to understand pricing risk and competitive behavior.
- Real-time E-Commerce price change tracking — continuous monitoring of listed prices as they change, so shifts are visible within minutes rather than after the fact.
- Retail price fluctuation analysis — the process of measuring the size and frequency of price movements across products, categories, and time periods.
- Amazon price Data Scraping — the automated collection of live Amazon listing prices at scale, across SKUs, categories, and sellers.
- Walmart price monitoring — continuous tracking of Walmart’s listed prices to detect changes as they happen.Scrape Flipkart price Data — the automated extraction of Flipkart product prices, commonly used to track sale-driven price swings.
Executive Summary
- Amazon shows the highest intra-day price change frequency of the three platforms, driven by automated repricing engines.
- Flipkart shows the sharpest price swings during flash sales and festive events, sometimes exceeding 10% within hours.
- Walmart shows comparatively steadier pricing but still shifts meaningfully around promotional windows and inventory clearance cycles.
- Categories with fast-moving competition — electronics, mobile devices, and small appliances — show the most frequent repricing activity.
- Sellers without real-time e-commerce price change tracking typically discover a competitor’s price move hours or days after it happens, often after losing buy-box or margin.
Industry Overview
Modern marketplace pricing is no longer static. Amazon, Walmart, and Flipkart all support — and increasingly encourage — algorithmic repricing, where prices adjust automatically based on competitor activity, demand signals, inventory levels, and time-based promotions.
What Is E-Commerce Price Volatility and Why Does It Matter?
E-commerce price volatility describes how often and how significantly a product’s listed price changes on a marketplace. It matters because every price movement can affect buy-box eligibility, profit margin, and a brand’s ability to enforce Minimum Advertised Price (MAP) agreements across resellers.
For sellers, this means the price a customer sees can change multiple times within a single day, without any manual action on the seller’s part. This shift has made e-commerce price volatility analysis a core part of pricing strategy rather than a periodic exercise.
Building this visibility at scale depends on reliable Ecommerce Data Scraping that can capture pricing changes accurately across thousands of SKUs and categories.
Key Findings
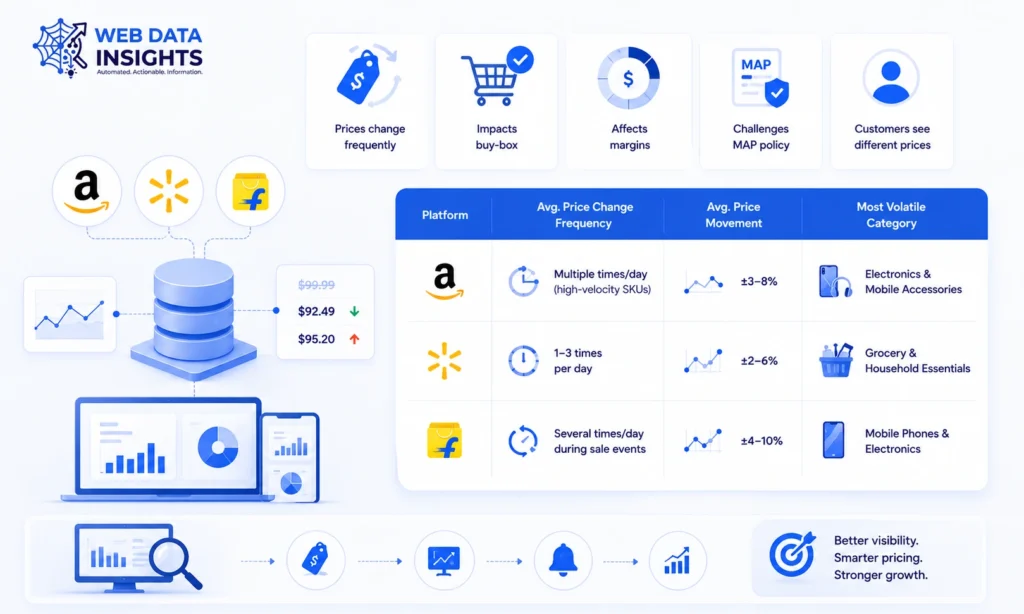
The table below summarizes average price change frequency and movement across Amazon, Walmart, and Flipkart.
| Platform | Avg. Price Change Frequency | Avg. Price Movement | Most Volatile Category |
| Amazon | Multiple times/day (high-velocity SKUs) | ±3–8% | Electronics & Mobile Accessories |
| Walmart | 1–3 times per day | ±2–6% | Grocery & Household Essentials |
| Flipkart | Several times/day during sale events | ±4–10% | Mobile Phones & Electronics |
Key Insight
- Amazon’s repricing activity is the most continuous of the three platforms, largely automated and driven by buy-box competition.
- Flipkart shows the widest single-event price swings, concentrated around flash sales and festive promotions.
- Walmart’s pricing is comparatively more stable outside of promotional cycles.
Data Analysis & Insights
Price movement across all three marketplaces follows identifiable patterns rather than random fluctuation.
How Real-Time Price Change Tracking Works
A structured retail price fluctuation analysis typically combines three layers of monitoring:
- Data collection — Amazon price Data Scraping, Walmart price monitoring, and tools that scrape Flipkart price data gather live prices at scheduled, frequent intervals.
- Change detection — Each price point is compared against its previous value to flag movement as soon as it happens, enabling real-time e-commerce price change tracking.
- Pattern analysis — Aggregated data reveals which categories, sellers, and time windows show the highest volatility, supporting faster pricing decisions.
What the Data Shows
- Repricing activity spikes in the 48 hours before and during major sale events, such as festive sales and clearance weekends.
- Electronics and mobile categories show the highest repricing frequency due to intense buy-box competition.
- Price drops are more common late in the day, as automated repricers respond to competitor activity and inventory pressure.
For teams building internal pricing models or benchmarking studies, structured Ecommerce Dataset resources help validate volatility trends against historical pricing behavior.
Industry Challenges
- Detection lag: Without continuous monitoring, sellers often notice a price change only after losing the buy box or sales momentum.
- MAP compliance risk: Frequent, automated repricing makes it harder for brands to enforce Minimum Advertised Price agreements consistently.
- Cross-platform complexity: Amazon, Walmart, and Flipkart each show different repricing behavior, making unified tracking difficult without structured data.
- Margin unpredictability: Rapid price swings during sale events can erode margin faster than manual pricing teams can react.
- Category-specific volatility: High-competition categories require more frequent monitoring than steady, low-competition SKUs.
Opportunities
- Faster competitive response: Continuous retail price fluctuation analysis allows sellers to adjust pricing within hours instead of days.
- Stronger MAP enforcement: Real-time visibility helps brands flag and act on MAP violations before they spread across resellers.
- Category-level pricing strategy: Understanding which categories move fastest helps teams prioritize monitoring resources efficiently.
- Cross-marketplace consistency: Sellers operating on all three platforms can align pricing strategy using consolidated volatility data.
Strategic Recommendations
- Set up real-time e-commerce price change tracking across Amazon, Walmart, and Flipkart rather than relying on manual daily checks.
- Prioritize monitoring for high-volatility categories such as electronics and mobile devices, where repricing happens most frequently.
- Combine platform-specific tracking with broader Price Monitoring Services to cover competitor SKUs beyond your own catalog.
- Build monitoring cadence around known high-volatility windows — sale events, festive periods, and inventory clearance cycles.
- Use dependable Web Scraping Services to ensure pricing data stays accurate as marketplace page structures change over time.
Best Practices for Ongoing Price Volatility Monitoring
- Track prices at intra-day intervals for high-velocity SKUs rather than once-daily checks.
- Segment monitoring by category, since electronics and mobile devices need closer attention than steady categories.
- Align monitoring cadence with known sale-event calendars for each marketplace.
- Treat e-commerce price volatility analysis as an ongoing discipline, not a one-time audit.
Future Outlook
Price volatility on Amazon, Walmart, and Flipkart is likely to increase, not decrease, as more sellers adopt automated repricing tools and marketplaces lean further into dynamic, demand-based pricing.
For sellers and brands, the ability to track price changes continuously — rather than periodically — will increasingly separate teams that protect margin from those that react too late. Investment in structured, real-time pricing intelligence is becoming a baseline requirement for competitive marketplace selling in 2026 and beyond.
Frequently Asked Questions
What is e-commerce price volatility?
E-commerce price volatility refers to how often and how significantly a product’s listed price changes on a marketplace, driven by factors like competitor activity, demand, and automated repricing.
How often do Amazon, Walmart, and Flipkart change prices?
Based on this research, Amazon shows the most frequent intra-day price changes, Flipkart shows the largest swings during sale events, and Walmart shows comparatively steadier pricing outside promotional periods.
Why does price volatility matter for sellers?
Frequent price changes affect buy-box eligibility, profit margins, and MAP compliance. Sellers without visibility into these changes often react too late to protect their position.
How can sellers track price changes in real time?
By using structured Amazon price Data Scraping, Walmart price monitoring, and tools that scrape Flipkart price data, sellers can track movement continuously instead of checking manually.
Which product categories see the most price volatility?
Electronics and mobile devices consistently show the highest repricing frequency across all three marketplaces studied.
What is retail price fluctuation analysis used for?
It is used to measure the size and frequency of price movements across products and categories, helping sellers anticipate volatility rather than react to it.
Conclusion
Price volatility on Amazon, Walmart, and Flipkart is no longer occasional — it’s constant, automated, and category-dependent. Sellers and brands who lack real-time visibility into these changes consistently lose margin and competitive position. This E-Commerce Price Volatility Report 2026 confirms that continuous, structured price tracking is now a core requirement for protecting profitability across marketplaces.
Reliable Web Data Solutions
WebDataInsights provides clean, structured, and real-time web scraping solutions tailored to your business goals, helping automate data collection for eCommerce, market research, lead generation, and more.
Get in TouchReady to Turn Your Data into Revenue Growth?
Partner with WebDataInsights for enterprise-grade B2B data scraping, real-time price monitoring, supplier benchmarking intelligence, and seamless API data delivery.
Request Custom Dataset