



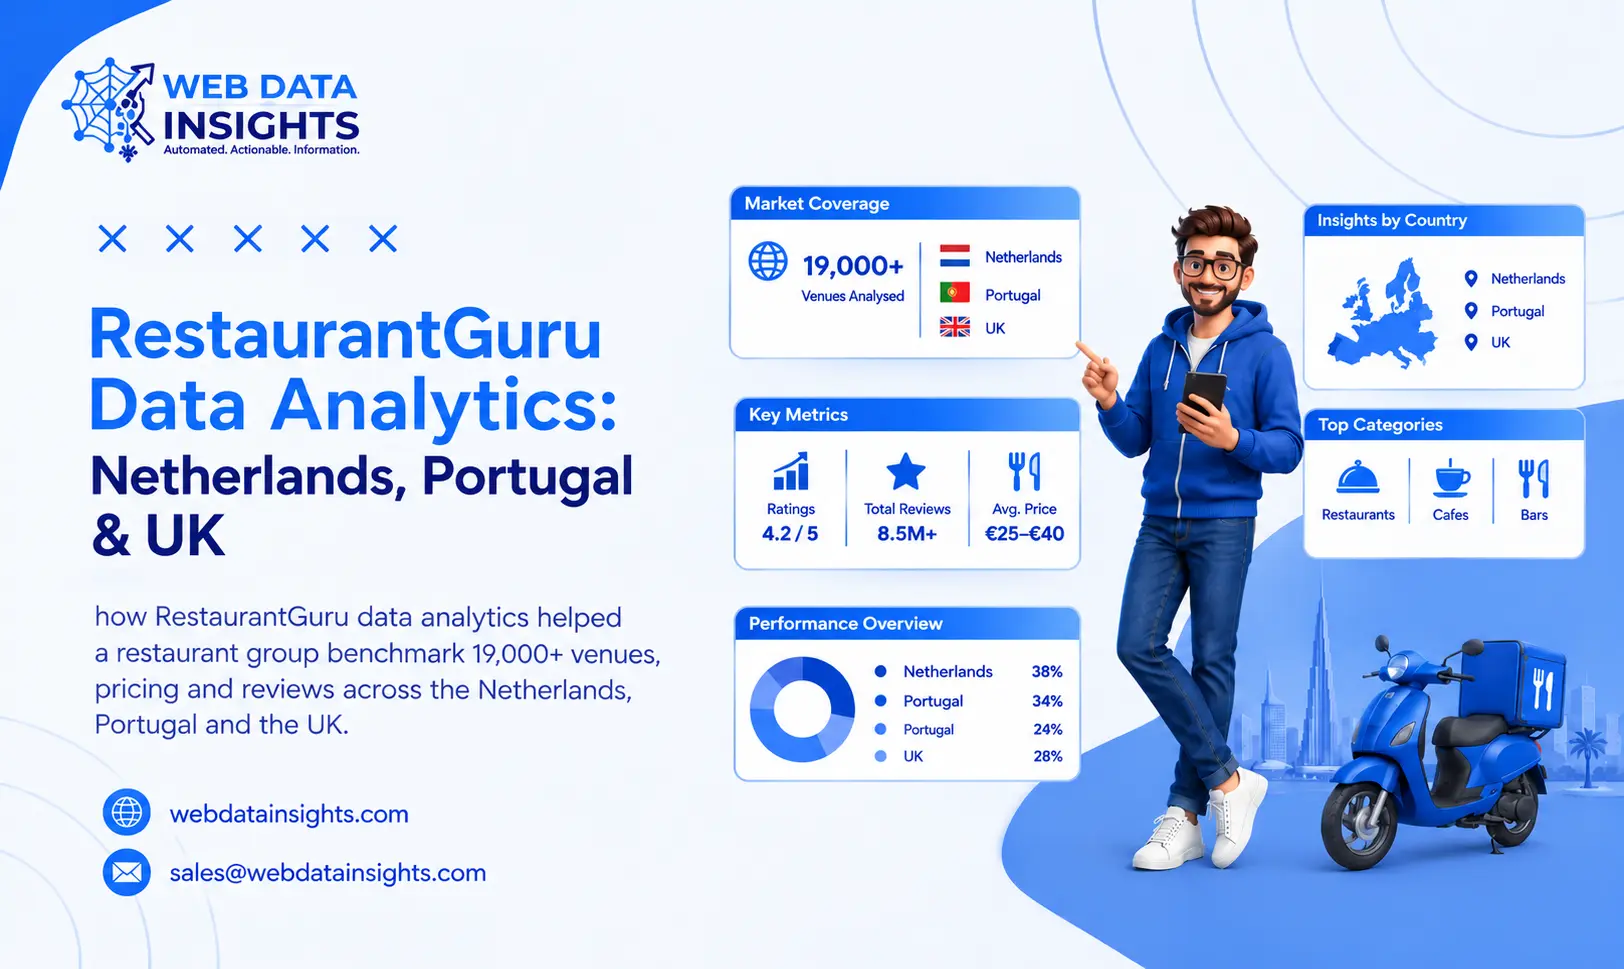
A multi-location restaurant group needed one reliable view of competitors, prices and guest sentiment in three countries. With RestaurantGuru data analytics, its team replaced scattered spreadsheets with one standardised dataset of 19,000+ venues, refreshed every month.
Executive Summary: What Did RestaurantGuru Data Analytics Change for This Client?
In short:
the client gained a clean, comparable view of venues, prices and reviews across three countries, so leadership could choose locations and set menu prices with evidence instead of instinct.
The client is a growing restaurant group planning expansion in the Netherlands, Portugal and the UK. These are large markets. The Netherlands had 16,230 restaurants in 2023 according to Dutch statistics (CBS), and the UK has an estimated 45,577 restaurants in one recent European foodservice analysis.
At that size, manual research cannot keep up. WebDataInsights collected public restaurant data, standardised it and delivered monthly market reports. The result was faster site decisions, sharper pricing and a clear list of guest experience priorities for each country.
Key takeaways
- 19,000+ venues across 12 cities in one standard format.
- 250,000+ guest reviews grouped into themes.
- Four price tiers and 25 cuisine groups used in every country.
- Monthly refreshes, so decisions use current data.
Client Background
The client is a mid-sized hospitality group (name withheld under NDA) running casual and mid-range restaurants, with plans to open new sites in three European markets. Its leadership team included operations, finance and expansion managers who all needed the same market facts.
| Profile | Detail |
|---|---|
| Business | Multi-location casual and mid-range restaurant group |
| Expansion plan | New sites in the Netherlands, Portugal and the UK |
| Research scope | 12 target cities, about 4 per country |
| Previous method | Manual browsing and spreadsheets |
Before the project, market research meant staff browsing listings, copying ratings into spreadsheets and relying on local manager opinion. It worked for one city. It did not work for three countries.
Business Challenge: Why Was RestaurantGuru Market Analysis So Hard to Do Manually?
The team wanted a repeatable RestaurantGuru market analysis. Three very different markets made that hard:
- Different market structures. In the UK, fast-food outlets (52,854) outnumber restaurants (45,577), while the Netherlands has 17,390 restaurants against 12,603 fast-food outlets, per a European foodservice analysis by Roamler.
- Inconsistent data. Each country used different currencies, cuisine labels and price descriptions.
- No pricing benchmark. Managers could not say whether menu prices were above or below nearby competitors.
- Review overload. Thousands of comments in several languages could not be read, let alone compared.
- Stale reports. By the time a manual study was finished, new venues had already opened.
Solution Strategy: How Does RestaurantGuru Data Extraction in 2026 Work?
Definition:
RestaurantGuru data extraction in 2026 means collecting publicly available restaurant fields, cleaning them and delivering them in an analysis-ready format on a regular schedule.
We designed a simple pipeline: define target cities, collect public listing fields, clean and standardise them, then refresh on a schedule. We only pulled what anyone can see on a public page, and we stayed within each site’s terms and its robots.txt file.
- For each venue we captured the name, address, cuisine, rating, the number of reviews behind that rating, the price level and the review text.
- We never kept reviewer names. Reviews were grouped into themes, which keeps the work on the right side of GDPR and UK GDPR.
- Euro and pound prices went into one currency and four price bands, so a Lisbon bistro and a Leeds one could finally be compared.
- Delivered data as clean files ready for the client’s analysts.
The collection layer used our Web Scraping Services, so the feed kept running when page layouts changed.
Implementation Process
| Step | What happened | Output |
|---|---|---|
| 1. Scope | Agreed 12 cities, 25 cuisine groups and 4 price tiers. | Approved project plan |
| 2. Collection | Gathered public listing data for all three countries. | Raw venue and review data |
| 3. Standardisation | Converted currencies, merged duplicates, unified cuisine labels. | 19,000+ clean venue records |
| 4. Analysis | Built city-level comparisons for density, pricing and sentiment. | Market dashboards |
| 5. Delivery | Shared monthly reports and raw files with leadership. | 12 refreshes a year |
In a later phase, the client added delivery-side insight using a Food Delivery Dataset and ongoing Food Delivery Data Scraping, to compare dine-in reputation with online demand.
Results & Outcomes
| Metric | Result |
|---|---|
| Countries covered | 3 (Netherlands, Portugal, UK) |
| Cities analysed | 12 |
| Venues standardised | 19,000+ (about 4,000 NL, 9,000 UK, 6,000 Portugal) |
| Reviews analysed | 250,000+ |
| Reporting cadence | Monthly, 12 refreshes a year |
| Comparison framework | 25 cuisine groups, 4 price tiers, one currency |
RestaurantGuru Netherlands Data Analytics: Where Was the Opportunity?
With about 4,000 Dutch venues covered, roughly a quarter of the 16,230 restaurants recorded in 2023, RestaurantGuru Netherlands data analytics showed which cities had strong demand but few highly rated venues in the client’s category. The expansion team shortlisted districts before visiting a single site.
RestaurantGuru UK Pricing Analytics: Were Menu Prices Competitive?
The UK is the largest of the three markets, so the dataset there was the biggest, at about 9,000 venues. RestaurantGuru UK pricing analytics gave managers a like-for-like benchmark by city, cuisine and price tier. Cuisine choice matters: one UK industry analysis counts 11,489 Italian, 11,378 Indian and 9,123 Chinese eating places, so competition varies sharply by menu type. The team then added Competitor Price Monitoring to track changes going forward.
RestaurantGuru Portugal Reviews Analytics: What Did Guests Care About?
Portugal’s restaurant sector is large for its size, with about 31,185 enterprises in restaurants and mobile food services in 2019, similar to the Netherlands (31,214) on the same Eurostat-based measure. RestaurantGuru Portugal reviews analytics grouped multilingual comments from about 6,000 venues into themes such as service speed, value for money and authenticity, giving local managers a short, prioritised fix list.
Key Learnings
- Ratings need volume. A rating only means something when read with review count.
- Definitions matter. Standard cuisine and price tiers are worth more than extra data.
- Themes beat comments. Aggregated review themes are more useful than individual comments.
- Refresh often. Monthly updates keep decisions current in fast-moving markets.
- Sort out data protection early. Decide how you will handle GDPR and UK GDPR before the first page is collected, not after the first report.
Industry Relevance: Which Other Businesses Can Use RestaurantGuru Data Analytics?
Restaurant Groups
Choose sites and benchmark menu prices before opening.
Food Delivery & Cloud Kitchens
Find underserved areas and cuisines.
Hospitality Investors
Screen markets before committing capital.
Food & Beverage Suppliers
Target fast-growing venues in each city.
Frequently Asked Questions
What is RestaurantGuru data analytics?
It means taking the public information about restaurants, such as ratings, reviews, cuisines and menu prices, and using it to see who your competitors are, where demand sits and what others charge.
What information do you collect about each restaurant?
Usually the venue name, address, cuisine, rating, number of reviews, price level and opening hours. Where a menu is listed, we also take the dish prices.
Is it legal to collect restaurant data from public listings?
In most cases, yes, as long as the information is public and you follow the site’s terms, its robots.txt file and data protection rules. Laws differ by country and by use, so check with a lawyer before you start.
How often should restaurant data be refreshed?
Monthly suits most market research. Pricing and promotions are better tracked weekly.
Can three countries be compared in one dataset?
Yes. With standard currencies, cuisine labels and price tiers, the Netherlands, Portugal and the UK can be compared side by side.
How do review analytics help restaurant owners?
They reveal repeated strengths and complaints, so owners can fix service gaps and adjust menus with evidence.
How many restaurants are there in the Netherlands, UK and Portugal?
Counts depend on definition. Recent figures show about 16,230 to 17,390 restaurants in the Netherlands and about 45,577 in the UK. Portugal had about 31,185 restaurant and mobile food enterprises in 2019.
Reliable Web Data Solutions
WebDataInsights provides clean, structured, and real-time web scraping solutions tailored to your business goals, helping automate data collection for eCommerce, market research, lead generation, and more.
Get in TouchReady to Turn Your Data into Revenue Growth?
Partner with WebDataInsights for enterprise-grade B2B data scraping, real-time price monitoring, supplier benchmarking intelligence, and seamless API data delivery.
Solve My Problem